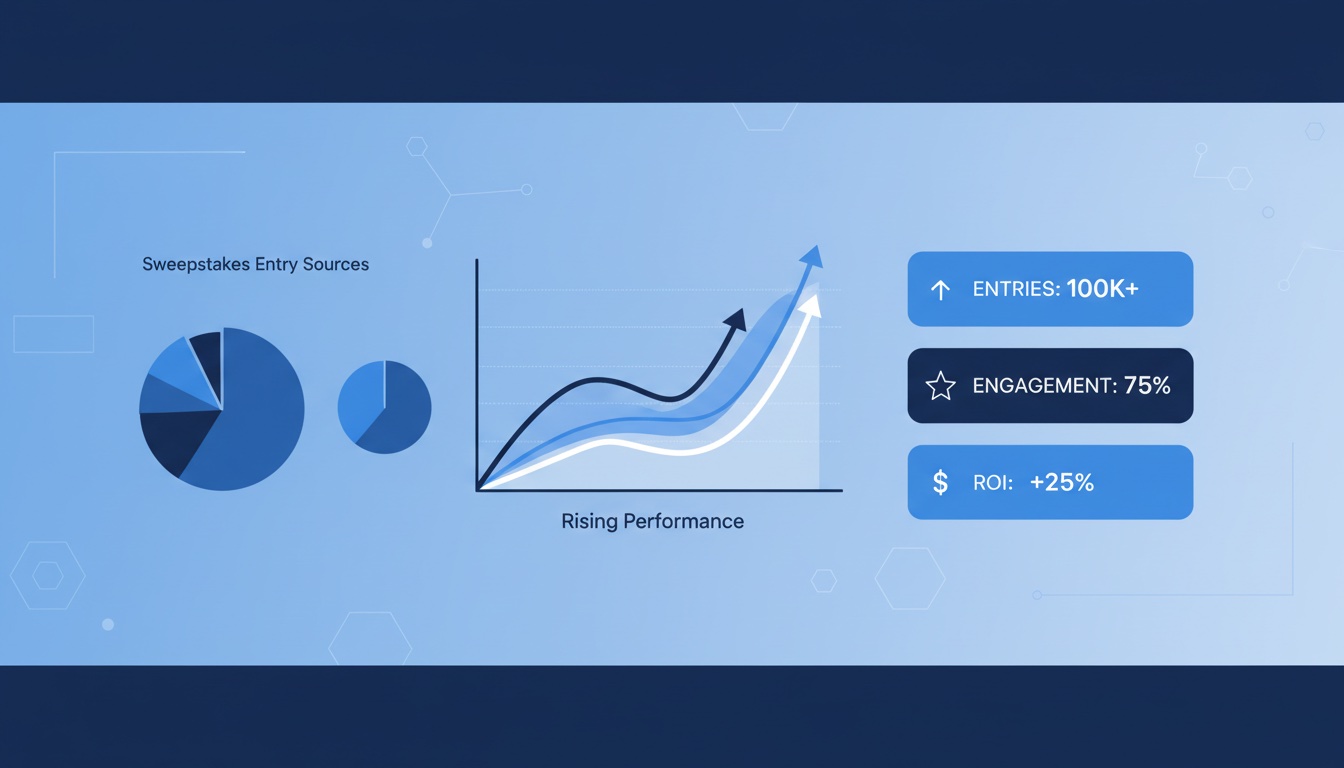
You can't defend a sweepstakes budget without benchmarks. When the CFO asks whether your last promotion "worked," the answer can't be "we got a lot of entries" — it needs to be a number, compared to an industry standard, with a clear dollar value attached.
This article compiles the benchmarks that matter for sweepstakes and contest marketing in 2026. Some figures come from published ad and landing-page studies, while others are directional planning ranges drawn from promotional campaign patterns. Use them as a starting framework, then calibrate with your own campaign history.
Why Benchmarks Matter for Promotional Marketing
Benchmarks turn vague campaign outcomes into actionable intelligence. Without them, you can't distinguish a strong result from a mediocre one — or know whether your promotional spend is outperforming (or underperforming) what you'd get from other channels.
Benchmarks serve three purposes: They help you set realistic pre-campaign targets, they give you comparison points for post-campaign reporting, and they provide the data you need to argue for budget allocation against paid ads, influencer marketing, and other channels competing for the same dollars.
The benchmarks in this guide span conversion rates, cost per lead, email acquisition costs, engagement metrics, and channel-level comparisons. If you need a full measurement framework beyond benchmarks, see our complete guide to measuring sweepstakes ROI.
The Headline Question: What Counts as Good ROI?
There is no single ROI figure that applies to every sweepstakes. A poorly targeted campaign with a generic prize can underperform, while a tightly targeted promotion with strong follow-up can create meaningful returns from lower acquisition costs and the long-tail value of owned audience growth.
That is why the rest of this guide focuses on the component metrics underneath ROI: landing-page conversion, cost per lead, subscriber quality, channel performance, and downstream conversion. Those are the numbers you can actually improve campaign to campaign.
Conversion Rate Benchmarks
Conversion rate — the percentage of visitors who become entrants — is the single most important efficiency metric for any promotion. It tells you how effectively your landing page and prize combination are turning traffic into participants.
| Metric | Industry Average | Top Performers | Context |
|---|---|---|---|
| Giveaway landing page conversion | 34% | 80%+ | vs. 6.6% for standard landing pages |
| Entry rate (all traffic sources) | 15-25% | 35%+ | Includes cold traffic from ads |
| Unique entrant ratio | 60-80% of total entries | 85%+ | Higher = less repeat gaming |
| Referral entry rate | 10-15% of total entries | 25%+ | Entries from participant sharing |
| Mobile entry rate | 55-65% of entries | 75%+ | Varies by audience demographic |
The standout number is 34% average conversion rate for giveaway landing pages, which is roughly 5x the average for standard landing pages. This gap exists because sweepstakes offer a clear, immediate value exchange — enter your information, get a chance to win something valuable. That clarity drives action.
If your conversion rate falls below 15%, investigate your prize selection, entry form length, and page load speed. If it exceeds 40%, you're outperforming most campaigns — document what's working for future campaigns.
Conversion rate depends on traffic quality
A 34% conversion rate assumes a mix of warm and cold traffic. If you're only sending your existing email list to the promotion (warm traffic), expect 40-60%. If you're running paid ads to cold audiences, 15-25% is solid. Always segment your conversion rate by traffic source for accurate analysis.
Cost Per Lead Benchmarks
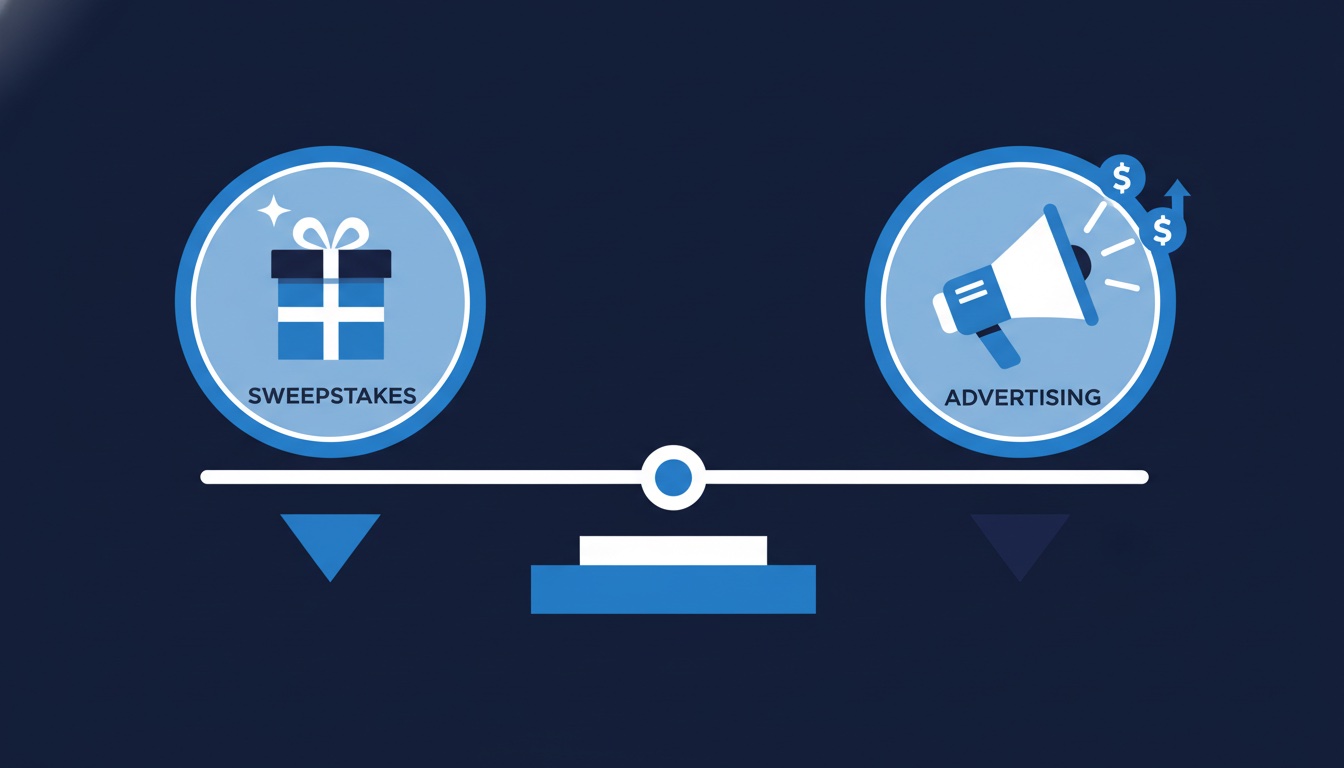
Cost per lead (CPL) is where sweepstakes benchmarks get interesting — because they're dramatically lower than most other acquisition channels. When you compare sweepstakes CPL to paid advertising CPL, the case for promotional marketing often makes itself.
| Channel | Average CPL | Range | Data Source |
|---|---|---|---|
| Google Ads | $70.11 | $28-$132 by industry | WordStream 2025 |
| Facebook Ads | $27.66 | $3-$80 by industry | WordStream 2025 |
| LinkedIn Ads | $75-$100+ | $50-$150+ | Industry reports |
| Sweepstakes/Giveaways | $0.50-$3.00 | $0.05-$5.00 | Multiple sources |
| Content marketing | $15-$50 | $10-$100+ | Varies by asset |
The contrast is stark. Google Ads averages $70.11 per lead across industries, while Facebook Ads averages $27.66. Sweepstakes consistently deliver leads at a fraction of these costs — often under $3.00 per lead even with prize, platform, and promotion costs included.
Exceptional campaigns can land well below $1 per lead, but that should be treated as upside rather than a planning assumption. For budgeting purposes, plan for roughly $1-3 CPL and compare actual performance against that range after launch. For a deeper channel comparison, see our sweepstakes vs. paid ads breakdown.
 Revup
Revup
Revup's built-in analytics dashboard tracks cost per lead, conversion rates, and channel attribution in real time — so you can benchmark your campaigns against industry standards without manual spreadsheet work.
Email Acquisition Benchmarks
For many brands, the primary goal of a sweepstakes is email list growth. Email remains the highest-ROI marketing channel — returning $36-$45 for every $1 spent — which means the value of each new subscriber acquired through a promotion is significant.
| Metric | Low | Average | Top Performers |
|---|---|---|---|
| New emails per campaign | 500-2,000 | 2,000-10,000 | 50,000+ |
| % of entrants who are new subscribers | 40-60% | 60-75% | 80%+ |
| Cost per new email (all-in) | $3.00+ | $1.00-$2.50 | Under $0.75 |
| 30-day email engagement (open rate) | 15-20% | 25-35% | 40%+ |
| 90-day conversion to customer | 1-2% | 3-5% | 8%+ |
The downstream value is where these benchmarks really matter. Once a subscriber is on an owned list and starts engaging with your nurture sequence, the acquisition cost becomes only the first step in a much longer revenue relationship. Model that value using your own 30/60/90-day engagement and conversion cohorts instead of relying on a generic lifetime-value multiplier.
The key qualifier is engagement quality. Not all sweepstakes emails are equal. Entries from sweepstakes directory sites will engage at much lower rates than entries from your own audience channels. Track engagement by acquisition source and don't treat your sweepstakes email cohort as a monolith. For detailed list-building tactics, see our email list building guide.
Social Media Engagement Benchmarks
Sweepstakes and contests are among the highest-engagement content types on social media. The data backs this up consistently across platforms.
| Metric | Benchmark | Context |
|---|---|---|
| Instagram account growth rate | Often faster than brand-only posting | Depends on prize fit, cadence, and creative quality |
| Likes per giveaway post | Typically higher than regular posts | Prize relevance and mechanic clarity matter most |
| Comments per giveaway post | Can spike sharply when comments drive entry | Driven by tag-a-friend and reply mechanics |
| Social follower retention (30-day) | 60-70% | Top performers retain 80%+ |
| Share rate (entries generating shares) | 5-15% | Higher with referral incentives |
The largest social swings usually show up in comments, because giveaway mechanics often ask entrants to reply, tag, or answer a prompt. Those comments are not equivalent to organic conversation, but they can still increase visibility and expose the campaign to a larger audience.
If you're running social-first promotions, make sure you understand the platform-specific contest rules for each network. Compliance failures can get your post removed or your account restricted — erasing those engagement gains entirely.
Social engagement ≠ business value without capture
Likes, comments, and follows are vanity metrics unless you convert them into owned contacts. Always pair social contest mechanics with a landing page entry form that captures email addresses. Social platforms can change their algorithms or suspend your account — your email list is the only audience you truly own.
Purchase Sweepstakes Benchmarks
Purchase-required sweepstakes (where buying a product earns entries) have a different benchmark profile than standard giveaways. The conversion rates are lower because the barrier to entry is higher — but the revenue impact is direct and measurable.
| Metric | Low | Average | Top Performers |
|---|---|---|---|
| Purchase lift during promotion | 5-8% | 12-18% | 25%+ |
| Incremental units per campaign | Varies | Varies | Best tracked against baseline |
| Post-promo sales retention (30-day) | 1-3% | 3-8% | 10%+ |
| Return on ad spend (ROAS) | 2-3x | 3-8x | 10x+ |
| Average order value lift | 5-10% | 10-20% | 25%+ |
The key metric for purchase sweepstakes is post-promotion retention — how much of the sales lift persists after the promotion ends. A campaign that drives 20% lift during the promo period but retains 5-8% at 30 days is creating lasting value. A campaign where sales drop back to baseline immediately was just pulling forward purchases, not creating new demand.
Revup's purchase sweepstakes feature supports receipt-based entry verification with a compliant alternative method of entry (AMOE) — which is legally required for any promotion that ties entry to a purchase. For CPG-specific benchmarks, see our CPG sweepstakes guide.
Benchmarks by Promotion Type
Different promotion formats produce different benchmark profiles. Here's how the major types compare:
| Promotion Type | Avg. Entry Rate | Avg. CPL | Best For | Engagement Depth |
|---|---|---|---|---|
| Standard Sweepstakes | 25-35% | $0.50-$2.00 | Email/list building | Low (single entry) |
| Contest (judged) | 10-20% | $2.00-$5.00 | UGC, brand engagement | High (content creation) |
| Instant Win | 30-40% | $0.75-$3.00 | Repeat visits, excitement | Medium (multiple plays) |
| Quiz/Survey | 20-30% | $1.00-$3.00 | Data collection, segmentation | High (question responses) |
| Purchase Sweepstakes | 5-15% | $3.00-$8.00 | Revenue lift, trial | High (purchase required) |
| Referral Campaign | 15-25% | $0.25-$1.50 | Viral growth | Medium (sharing required) |
Referral campaigns tend to deliver the lowest CPL because participants do the promotion work for you — each entrant recruits additional entrants, which divides your fixed costs across a larger pool. Referral sweepstakes programs are particularly effective for brands with an existing engaged audience to seed the initial sharing.
Contests have higher CPL but produce deeper engagement — participants who create content (photos, videos, essays) have invested effort and are more likely to become customers. The trade-off is volume: you'll get fewer entries but higher-quality leads.
Revup
Revup supports all six promotion types — sweepstakes, contests, instant win, quizzes, surveys, purchase rewards, referral rewards, and forms — so you can choose the format that matches your benchmark goals.
Brand Awareness and Recall Benchmarks
For campaigns where the primary goal is awareness rather than direct acquisition, the relevant benchmarks shift from CPL and conversion rates to reach, recall, and brand perception.
| Metric | Benchmark | How to Measure |
|---|---|---|
| Brand recall among participants | 83% | Post-campaign survey |
| Promotional product retention | 12+ months | Survey — recipients keep branded items |
| Social reach multiplier | 5-15x entry count | Impressions ÷ entries |
| Earned media value | 2-5x paid promotion cost | PR coverage + social shares valued at CPM |
| Website traffic lift during promo | 30-100%+ | Analytics vs. pre-promo baseline |
The 83% brand recall rate for promotional participants is significantly higher than typical advertising recall benchmarks. This makes sense — sweepstakes participants actively engage with your brand (filling out forms, reading rules, sharing with friends), which creates stronger memory encoding than passive ad exposure.
For brands where awareness is the primary KPI, pair your sweepstakes with branded promotional products as prizes. Participants who keep branded items extend the awareness window far beyond the campaign period.
Benchmarks by Industry Vertical
Benchmark expectations vary significantly by industry. A conversion rate that's exceptional in financial services would be average in ecommerce. Here's how the numbers shift across verticals:
| Industry | Typical Entry Rate | Avg. CPL | Best Promotion Type | Key Metric Focus |
|---|---|---|---|---|
| Ecommerce | 25-35% | $0.50-$2.00 | Product giveaway / referral | Email acquisition, purchase lift |
| CPG / FMCG | 15-25% | $1.50-$4.00 | Purchase sweepstakes / instant win | Purchase lift, trial |
| Restaurants | 30-40% | $0.25-$1.50 | Photo contest / local giveaway | Foot traffic, social growth |
| Beauty & Skincare | 25-35% | $0.75-$2.50 | UGC contest / influencer giveaway | Social engagement, UGC volume |
| Hotels & Hospitality | 20-30% | $1.50-$3.50 | Stay giveaway / loyalty promo | Bookings, loyalty sign-ups |
| Sports & Entertainment | 30-40% | $0.50-$2.00 | Ticket giveaway / prediction | Engagement, app downloads |
| Media & Publishing | 20-30% | $1.00-$3.00 | Subscriber giveaway | Subscriptions, email growth |
| B2B / SaaS | 10-20% | $3.00-$8.00 | Survey / quiz with incentive | Lead quality, data collection |
For deeper guidance on running promotions in your specific vertical, see our industry playbook hub, which includes detailed strategy guides for restaurants, ecommerce, CPG, beauty, hospitality, and more.
How to Use These Benchmarks
Applying Benchmarks to Your Campaigns
Set pre-campaign targets
Before launching, establish target ranges for your 3-5 most important metrics using the benchmarks above. Write them down. Share them with stakeholders. This prevents goalpost-moving after the fact.
Account for your specific context
Adjust benchmarks based on your industry, audience size, prize value, and promotion budget. A $50,000 prize sweepstakes will have different benchmarks than a $500 product giveaway. Use the industry-specific tables as your starting point.
Measure against benchmarks during the campaign
Monitor entry rate, CPL, and channel performance daily. If your entry rate is below the low end of the benchmark range by day 3, investigate prize appeal, page experience, or traffic quality — don't wait until the campaign ends.
Report using comparative language
In your post-campaign report, show your results alongside the benchmark range. 'We acquired emails at $1.25 each — 38% below the industry average of $2.00' is far more persuasive than 'we acquired 5,000 emails.'
Build your own benchmark library over time
After 3-5 campaigns, your internal benchmarks will be more relevant than industry averages. Track results consistently across campaigns to build your own performance baseline.
Common Benchmark Pitfalls
Benchmarks are powerful tools, but they can mislead if used incorrectly. Here are the most common mistakes:
Benchmark Pitfalls to Avoid
- Comparing total entries instead of unique entrants — total entries are inflated by repeat entries and don't reflect actual audience reached
- Ignoring traffic source when measuring conversion rate — a 20% rate from cold paid traffic is better than a 30% rate from your existing email list
- Using CPL without including all costs — your CPL must include prize value, platform fees, paid promotion, creative production, and staff time
- Treating all email subscribers as equal — segment by source and measure engagement at 30/60/90 days to understand real value
- Comparing a first campaign to top-performer benchmarks — use 'average' benchmarks for new programs and 'top performer' targets for mature programs
- Measuring only during the campaign window — downstream metrics (email engagement, customer conversion) need 30-90 days to materialize
Benchmarks for Budget Planning
These benchmarks can help you work backward from goals to budget. If your target is 5,000 new email subscribers and you're planning a standard sweepstakes, here's the math:
| Target | Benchmark CPL | Estimated Budget | Assumptions |
|---|---|---|---|
| 1,000 new emails | $1.50/email | $1,500 total | Mid-range prize, owned channel promotion |
| 5,000 new emails | $1.50/email | $7,500 total | Includes prize, platform, promotion costs |
| 10,000 new emails | $1.25/email | $12,500 total | Scale advantage on fixed costs |
| 25,000 new emails | $1.00/email | $25,000 total | Requires paid promotion investment |
| 50,000+ new emails | $0.75-$1.00/email | $37,500-$50,000 | Major prize, multi-channel push |
These are planning estimates, not guarantees. Your actual CPL will depend on prize appeal, audience targeting, promotion effort, and competitive timing. Build a 20% buffer into your budget for contingencies, and start with a smaller campaign to establish your own baseline before committing to larger targets.
Revup
Ready to start planning your first measurable promotion? Revup offers a free tier that lets you launch your first sweepstakes and establish baseline metrics before scaling up.
Tracking Benchmarks Over Time
The most valuable benchmarks are your own. Industry averages give you a starting point, but after running 3-5 campaigns, you'll have internal data that's far more predictive of future performance.
What to Track Across Campaigns
- Entry rate by traffic source (email, social, paid, organic)
- CPL by promotion type (sweepstakes, contest, instant win, quiz)
- Email engagement rate by acquisition campaign (30/60/90 day)
- Customer conversion rate by sweepstakes cohort
- Prize value-to-entry ratio (helps optimize prize selection)
- Seasonal performance variation (Q4 vs Q1, etc.)
- Channel efficiency (which paid channels deliver the lowest CPL)
Revup's analytics dashboard tracks entries, conversions, channel attribution, and campaign performance data automatically. Exporting this data after each campaign builds the benchmark library you need for increasingly accurate planning.
Frequently Asked Questions
What's a good ROI for a first sweepstakes campaign?
For a first campaign, focus on learning rather than maximizing ROI. A positive ROI is a strong first result, but even a break-even campaign can be worthwhile if it gives you reliable benchmarks for conversion rate, subscriber quality, and channel performance. Use your first campaign to establish baseline metrics, then optimize from there.
How do sweepstakes benchmarks compare to other lead generation methods?
Sweepstakes consistently deliver lower cost per lead than paid advertising. Google Ads averages $70.11 per lead and Facebook Ads averages $27.66, while sweepstakes typically deliver leads at $0.50-$3.00. The trade-off is that paid ad leads come from active searchers (higher intent), while sweepstakes leads are driven by prize appeal (lower intent but higher volume). The best strategies use both channels together.
Are sweepstakes leads lower quality than paid ad leads?
It depends on the campaign design. A generic "$1,000 cash giveaway" will attract sweepstakes hobbyists with low purchase intent. A product-specific giveaway targeted to your ideal customer profile will attract leads that look much more like your paying customers. The quality of sweepstakes leads is primarily determined by prize relevance and targeting — not the channel itself. Track 30-day email engagement and 90-day conversion rate to measure actual lead quality.
How often should I update my benchmark targets?
Review and update benchmarks quarterly if you're running frequent campaigns, or after every 3-5 campaigns if you run promotions less often. Industry benchmarks shift as platforms change (algorithm updates, new ad formats, privacy regulations), and your internal benchmarks evolve as you improve your promotional strategy. Re-baseline annually at minimum.
What benchmarks should I include in my post-campaign report?
At minimum: total entries, unique entrants, entry rate, cost per lead, new email subscribers, cost per new email, and ROI. If applicable, include purchase lift, social follower growth, and referral rate. Always compare to both industry benchmarks and your own prior campaigns. For a complete reporting framework, see our sweepstakes ROI measurement guide.
Ready to build a benchmark-driven promotional strategy? Explore our complete sweepstakes marketing strategy guide or dive into the sweepstakes vs. paid ads comparison to see how promotional marketing stacks up against your existing acquisition channels.